Recently, I encountered a Percona Monitoring and Management (PMM) server that was rapidly approaching complete disk exhaustion. This post outlines the steps taken to identify the issue and reclaim disk space.
$ df -h
Filesystem Size Used Avail Use% Mounted on
/dev/sda1 523G 508G 16G 98% /
With only 16GB remaining on a 523GB drive, this PMM installation was on the brink of failure. If you’re experiencing similar issues with your PMM deployment, this guide details how to identify and resolve PMM disk space issues.
BTW did you know, PMM 3.0 is already out?
Identifying the Culprit
After inspecting common culprits like system logs and temporary files, the main disk usage was traced to /var/local/percona/pmm/srv/, a mount used by the PMM container. Within it, the ClickHouse database specific folder was the primary space consumer.
ClickHouse in PMM
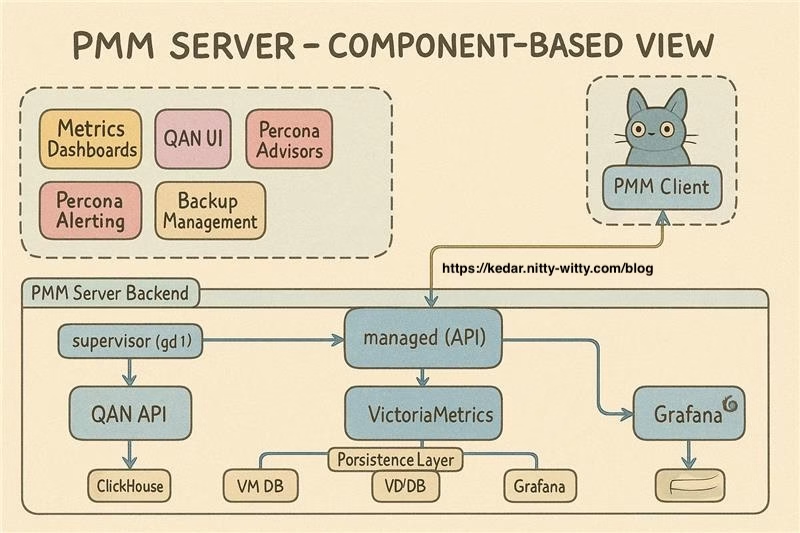
Probably you already know but if not, question is, what’s ClickHouse is housing in PMM’s architecture that is utilizing so much disk?
ClickHouse is an open-source, column-oriented database management system that excels at real-time analytics on large datasets. Within the PMM ecosystem, ClickHouse facilitates the Query Analytics functionality. This explains why the ClickHouse database can grow significantly over time, especially in environments monitoring numerous database instances with heavy query loads.
Investigation: Tracking Down the Biggest Tables
To identify which specific tables were responsible for the excessive disk usage, I connected to the PMM server container:
# Connect to the PMM server container
podman exec -it pmm-server /bin/bash

# or if you're using docker
docker exec -it pmm-server /bin/bash
Once inside the container, following queries was run against ClickHouse to identify the largest tables:
$ clickhouse-clientSELECT database, table, SUM(bytes_on_disk) AS size_on_disk, COUNT() AS parts_count
FROM system.parts
WHERE active = 1
GROUP BY database, table
ORDER BY size_on_disk DESC;┌─database─┬─table─────────────────────┬─size_on_disk─┬─parts_count─┐
│ system │ trace_log │ 346710891455 │ 48 │
│ system │ asynchronous_metric_log │ 4216804400 │ 37 │
│ system │ metric_log_0 │ 4096890831 │ 84 │
│ system │ metric_log │ 3300187902 │ 35 │
...The system.trace_log table was consuming a whopping 346GB! This table stores trace information for ClickHouse queries and operations.
Drilling Down: Analyzing Partitions
To understand the issue with the trace_log table, its partition details were reviewed:
SELECT database, table, partition, sum(rows) AS rows, sum(bytes_on_disk) AS size_on_disk
FROM system.parts
WHERE active = 1 AND table = 'trace_log'
GROUP BY database, table, partition
ORDER BY partition ASC;
The output of above query exhibited the problem:
┌─database─┬─table─────┬─partition─┬───────rows─┬─size_on_disk─┐
│ system   │ trace_log │ 202405    │   19230736 │    353844712 │
│ system   │ trace_log │ 202406    │ 2972432060 │  48032655534 │
│ system   │ trace_log │ 202407    │ 3500442984 │  56447376224 │
│ system   │ trace_log │ 202408    │ 3381851250 │  53964707527 │
│ system   │ trace_log │ 202409    │ 3138145807 │  50178088805 │
│ system   │ trace_log │ 202410    │ 3307448245 │  52953410205 │
│ system   │ trace_log │ 202411    │ 3184102845 │  51206343208 │
│ system   │ trace_log │ 202412    │ 2093835550 │  33552956631 │
│ system   │ trace_log │ 202501    │    1183332 │     21518446 │
└──────────┴───────────┴───────────┴────────────┴──────────────┘
The table contained partitions dating back over 8 months! This historical data was consuming massive amounts of disk space but provided little value for current monitoring needs.
Looking at the Table Structure
SHOW CREATE TABLE system.trace_log;The output confirmed that the table was partitioned by month but had no TTL (Time To Live) policy to automatically purge old data:
CREATE TABLE system.trace_log
(
    `event_date` Date,
    `event_time` DateTime,
    ...
)
ENGINE = MergeTree
PARTITION BY toYYYYMM(event_date)
ORDER BY (event_date, event_time)
SETTINGS index_granularity = 8192
The Solution: Two-Part Approach
1. Implementing Automatic Data Retention with TTL
Our first step was to add a TTL policy to automatically remove data older than 30 days:
# Edit the ClickHouse configuration
vi /etc/clickhouse-server/config.xml
added the following TTL definition in the specific section for the table trace_log:
<ttl>event_date + INTERVAL 30 DAY DELETE</ttl>Then restarted ClickHouse to apply the changes:
supervisorctl restart clickhouseAfter the restart, we verified the change was applied by checking the table definition again:
SHOW CREATE TABLE system.trace_log;The updated definition now included:
[root@pmm-host-server opt]# clickhouse-client
ClickHouse client version 23.8.2.7 (official build).
Connecting to localhost:9000 as user default.
Connected to ClickHouse server version 23.8.2 revision 54465.

pmm-host-server :) SHOW CREATE TABLE system.trace_log;

SHOW CREATE TABLE system.trace_log

Query id: 4a2f87cb-0030-4751-b17d-08aa84f38abb

┌─statement──────────────────────────────────────────────────────────────────────────────────────────────────────────────────────────────────────────────────────────────────────────────────────────────────────────────────────────────────────────────────┐
│ CREATE TABLE system.trace_log
(
    `event_date` Date,
    `event_time` DateTime,
    `event_time_microseconds` DateTime64(6),
    `timestamp_ns` UInt64,
    `revision` UInt32,
    `trace_type` Enum8('Real' = 0, 'CPU' = 1, 'Memory' = 2, 'MemorySample' = 3, 'MemoryPeak' = 4, 'ProfileEvent' = 5),
    `thread_id` UInt64,
    `query_id` String,
    `trace` Array(UInt64),
    `size` Int64,
    `ptr` UInt64,
    `event` LowCardinality(String),
    `increment` Int64
)
ENGINE = MergeTree
PARTITION BY toYYYYMM(event_date)
ORDER BY (event_date, event_time)
TTL event_date + toIntervalDay(30)
SETTINGS index_granularity = 8192 │
└────────────────────────────────────────────────────────────────────────────────────────────────────────────────────────────────────────────────────────────────────────────────────────────────────────────────────────────────────────────────────────────┘
2. Manually Removing Historical Data
I decided to manually remove the existing historical data to reclaim disk space immediately and began dropping old partitions:
ALTER TABLE system.trace_log_1 DROP PARTITION '202405';
ALTER TABLE system.trace_log_1 DROP PARTITION '202406';
But it wasn’t straight forward… I hit a roadblock by configuration variable max_[table/partition]_size_to_drop as the partition being dropped is more than 50G the operation was aborted with an error and possible solutions.
pmm-host-server :) ALTER TABLE system.trace_log_1 DROP PARTITION '202407';

ALTER TABLE system.trace_log_1
    DROP PARTITION '202407'

Query id: f2b93063-57df-444f-9199-82c7695f39b9


0 rows in set. Elapsed: 0.003 sec.

Received exception from server (version 23.8.2):
Code: 359. DB::Exception: Received from localhost:9000. DB::Exception: Table or Partition in system.trace_log_1 was not dropped.
Reason:
1. Size (56.45 GB) is greater than max_[table/partition]_size_to_drop (50.00 GB)
2. File '/srv/clickhouse/flags/force_drop_table' intended to force DROP doesn't exist
How to fix this:
1. Either increase (or set to zero) max_[table/partition]_size_to_drop in server config
2. Either create forcing file /srv/clickhouse/flags/force_drop_table and make sure that ClickHouse has write permission for it.
Example:
sudo touch '/srv/clickhouse/flags/force_drop_table' && sudo chmod 666 '/srv/clickhouse/flags/force_drop_table'. (TABLE_SIZE_EXCEEDS_MAX_DROP_SIZE_LIMIT)

pmm-host-server :)
ClickHouse has a safety mechanism that prevents dropping large partitions (>50GB) without explicit confirmation.
To work around this, I created a force drop flag as noted in the instructions above:
touch '/srv/clickhouse/flags/force_drop_table' && chmod 666 '/srv/clickhouse/flags/force_drop_table'With this flag in place, it’s possible to drop the larger partitions:
ALTER TABLE system.trace_log_1 DROP PARTITION '202407';Note that the flag is automatically removed after each operation, so it needed to be recreated before dropping each large partition.
Results and Long-term Prevention
After implementing our solution, I successfully reduced the disk usage and established a sustainable automatic cleanup process. The TTL configuration ensures that trace logs older than 30 days will be automatically purged, preventing future disk space issues.
The Percona team is aware of this issue and is working on implementing better default TTL policies for system tables in future PMM releases. A bug report (PMM-13644) has been filed to address this issue more permanently.
Until these improvements are implemented in future PMM versions, the workaround described in this case study will help you manage ClickHouse disk usage effectively.
Conclusion
Reclaiming disk space in PMM is crucial for maintaining optimal server performance and monitoring efficiency. As shown in this case study, understanding PMM’s internal components, such as the trace_log table in ClickHouse, helps identify the root cause of disk usage issues.
Have you faced similar issues with your PMM deployment? Share your strategies for managing disk usage in the comments below!